24-July. Experimental Activity. U-value of a building model
Measuring the Thermal Transmittance of a building model
The BASIC IDEA.

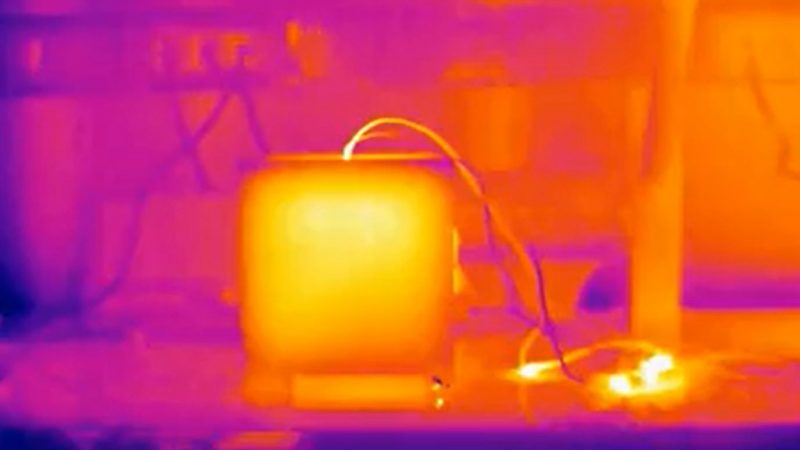
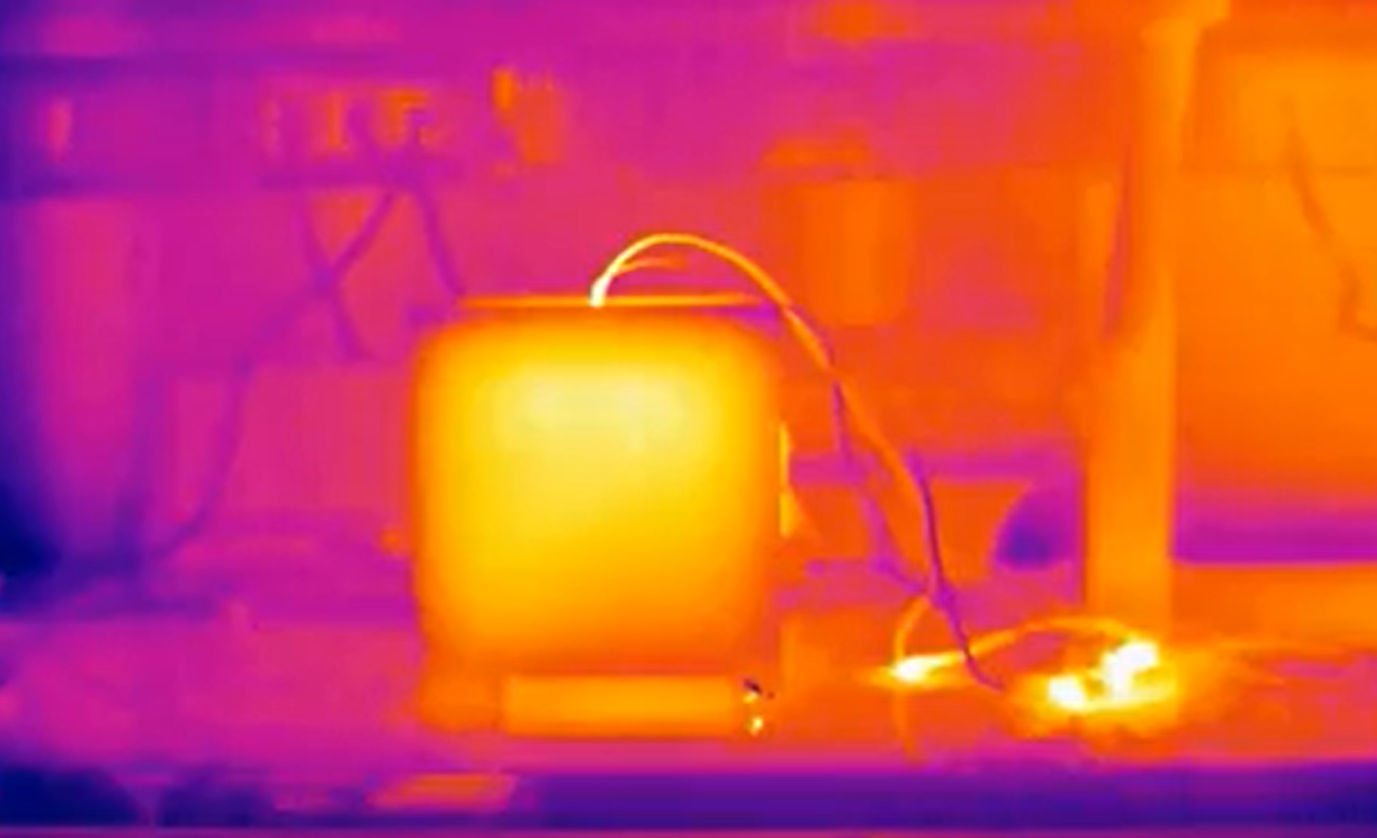
This our building model. It’s a 3D printed box. You can remove the roof, which has an hole to get all the required wiring and sensors into the building.
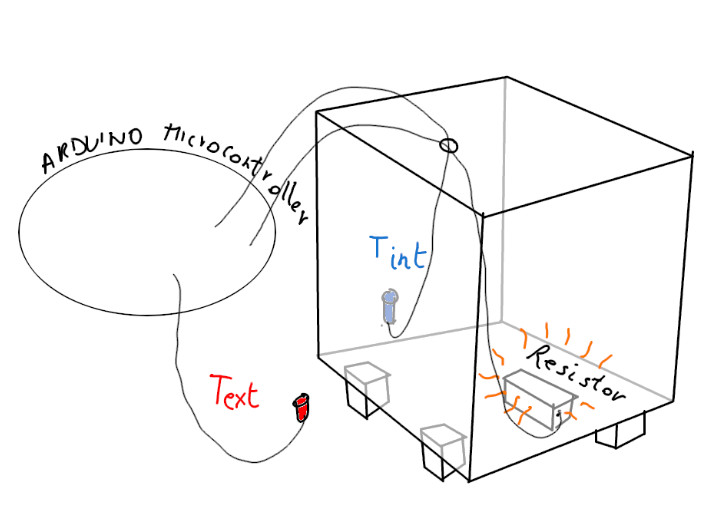
The basic idea is to control a resistor (our heating system), placed inside the box , to maintain a fixed temperature difference \(\Delta\)T between the inside and the outside of the building. The resistor heats the internal volume dissipating a known electrical power and can be turned on or off by the Arduino micro-controller. We measure the internal and external temperature vs. time. With this data, knowing the total surface of the box, we can measure the Transmittance U of the building model.
General Overview of the Experimental apparatus
Getting the heating system ready
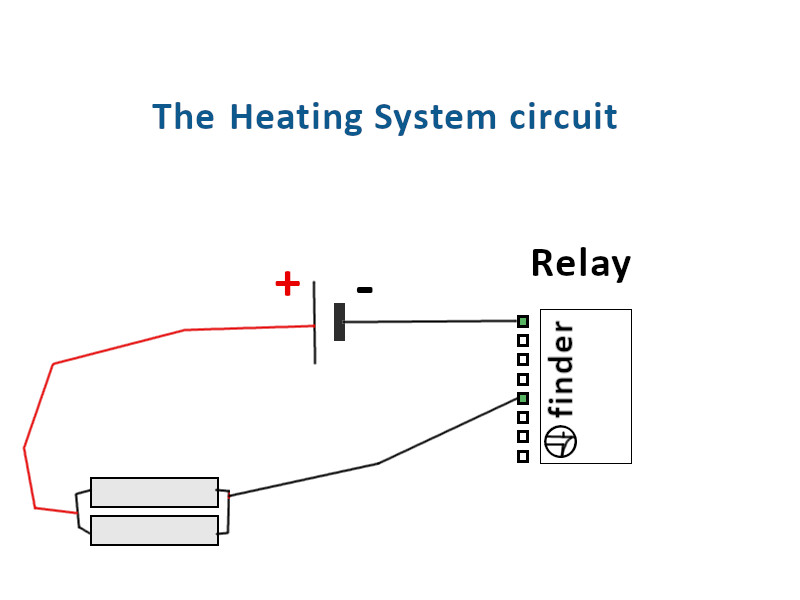
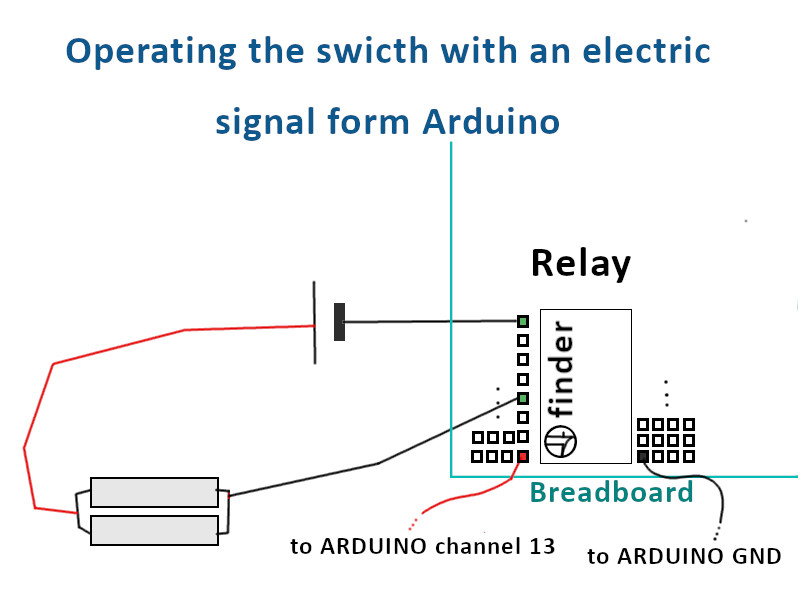
How to connect the heating system (two resistors in parallel) to the poles of the voltage generator and to the Relay (which is an electrically operated switch)
Placing the temperature sensors
Controlling the heating system with Arduino
Checking the heating system circuit
Setting up the ARDUINO microcontroller
- Connect the Arduino USB cable to the USB port of the Computer
- Click on the top-left icon “This PC“, Open the directory “C:“, open the directory “Temp/heat_loss/on_off_controller“.
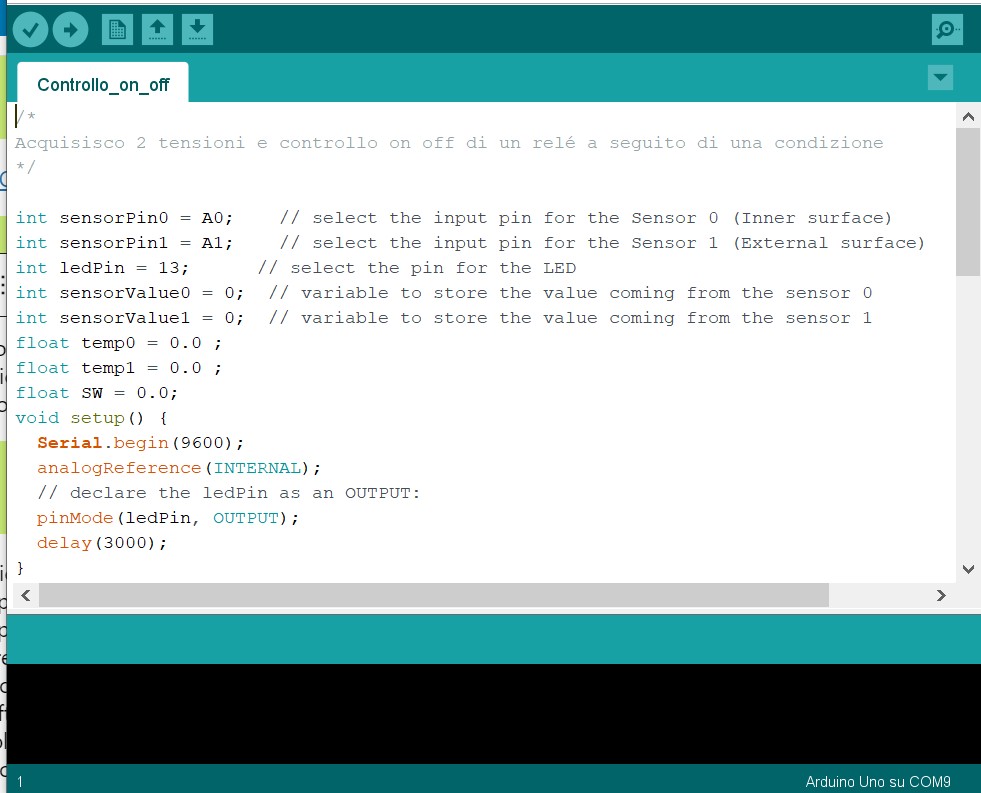
- Double click on the .ino file, which contains the code that we need to upload on the Arduino.
- Once the .ino file is opened click on the horizontal arrow icon in the top menu bar. This should star the uploading of the code on the Arduino micro-controller. However, before the start of the upload you should be asked to select the correct COM port on which the Arduino is connected (hopefully a pop-up windows will prompt this, suggesting you the COM port to which the device is connected).
- The upload starts and Arduino will give you a feedback on whether the operation was successful or not.
- Now you can even close the Arduino window that you have on your monitor. The code that will let Arduino control the relay is now on board the micro-controller.
- When you this procedure is completed, the code automatically starts running on Arduino. Therefore, as the thermal gradient should be less then 10°C, the LED should light up immediately and current should start flowing in the heating circuit (check this on the generator display).
Data Acquisition: COOLTERM
Coolterm is a software that will capture the temperature data coming from the two sensors and will store them on a .txt file. This will give you the opportunity to analyse you data after the experimental phase and to calculate the Transmittance of our building model. Now. you have to open this software and set it up.
- Click on the top-left icon “This PC“, Open the directory “C:“, open the directory “Temp/heat_loss/Coolterm“
- Run the coolterm .exe file
- Choose the COM port on which data flows: click on “Connection” in the top menu bar, then on “Options…”. On the left colus select “Serial Port”, on the right, from the “Port:” dropdown menu, choose the COM port to which Arduino is connected.
- Remaining in the same “Option” window”, select “Receive” on the left column; Check the box “Add timestamps to captured data” (if you don’t do that just remember that data are collected every 4 seconds). Press the OK button on the bottom in order to save your choices.
- Press the Connect button (USB icon)
- Move again to the “connection” tab and select “Capture to text/binary file”; When you are ready press the START button. A .txt file begins to be written, it will store your temperature data.
Data Analysis