Simple Pendulum
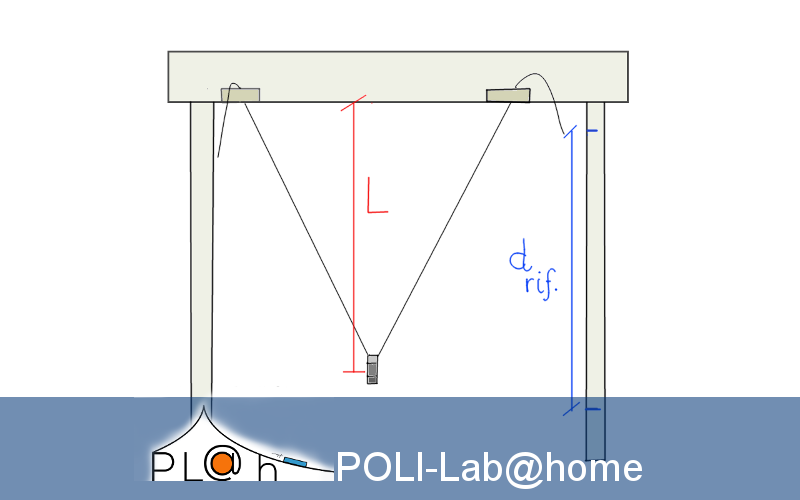
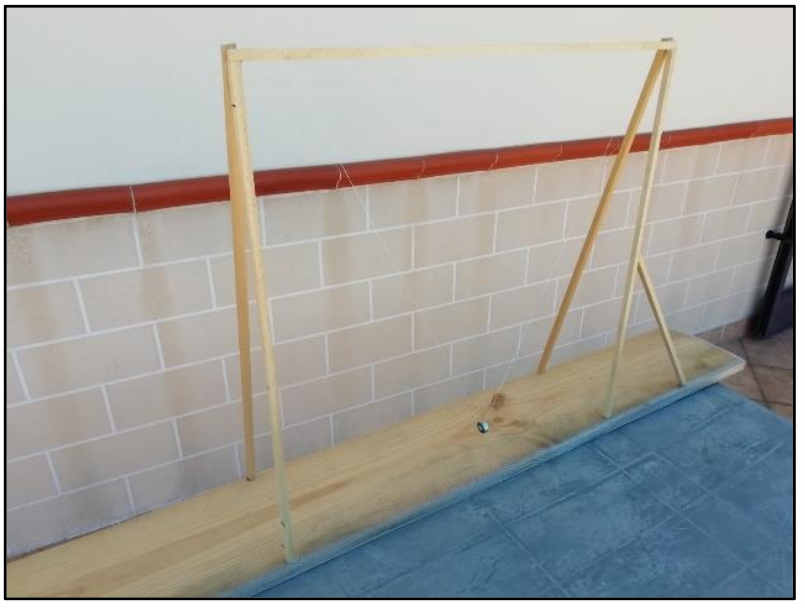
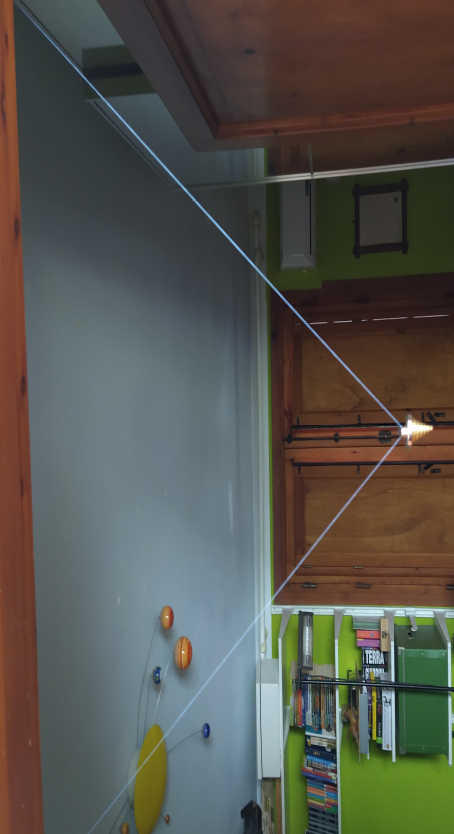
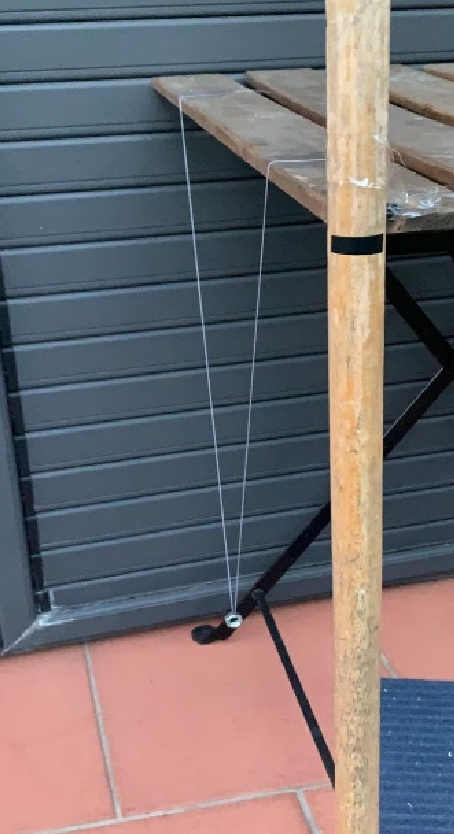
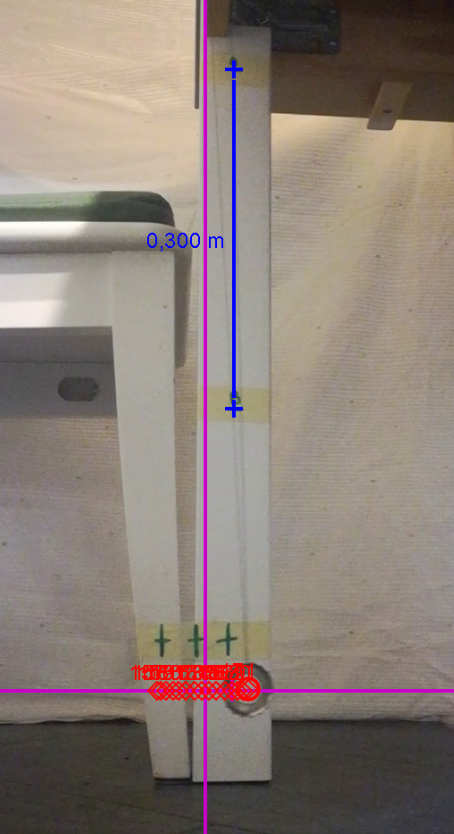
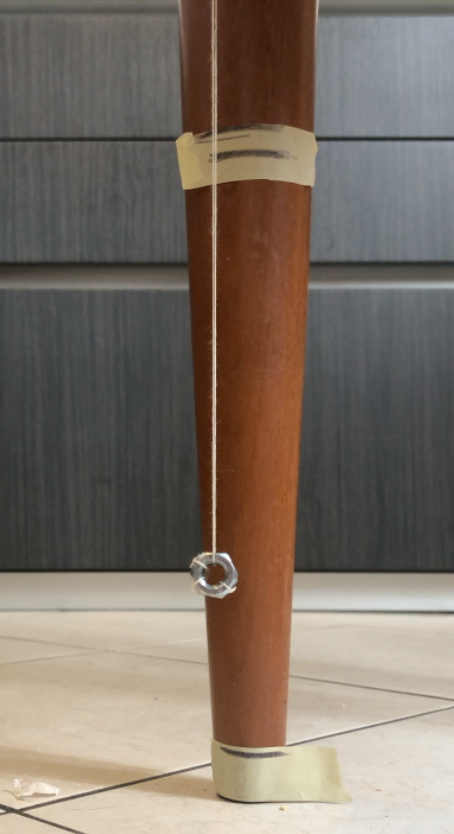
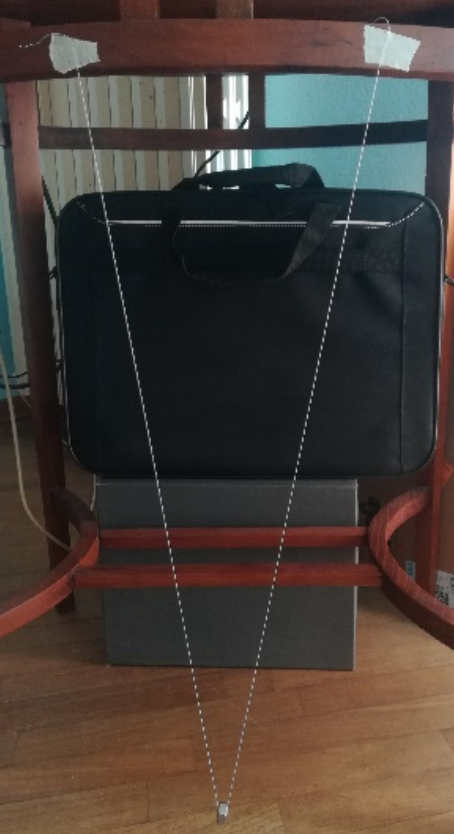
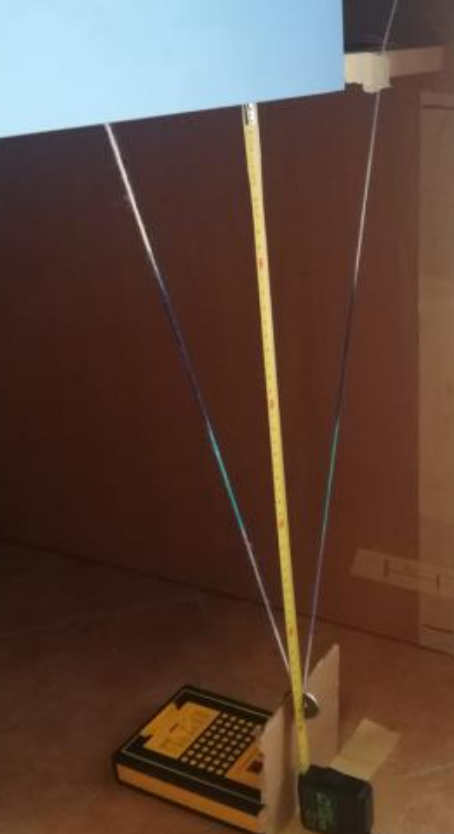
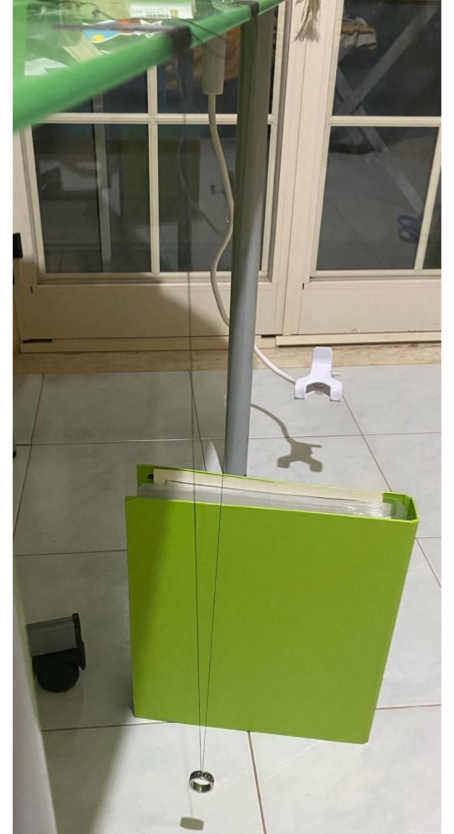
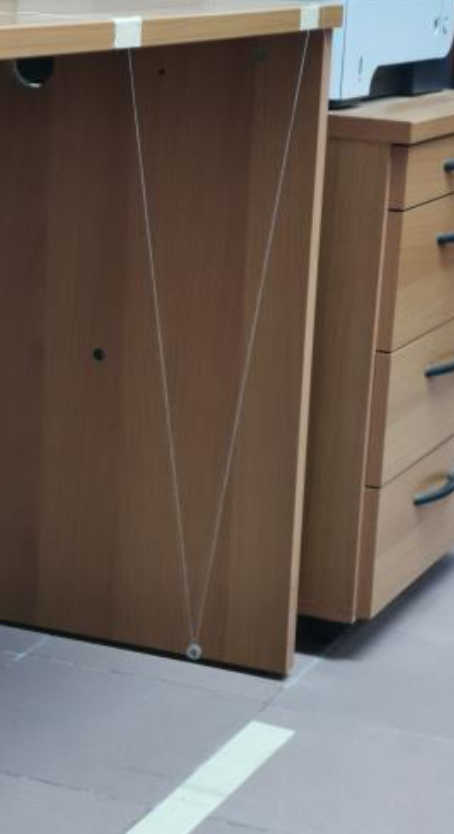
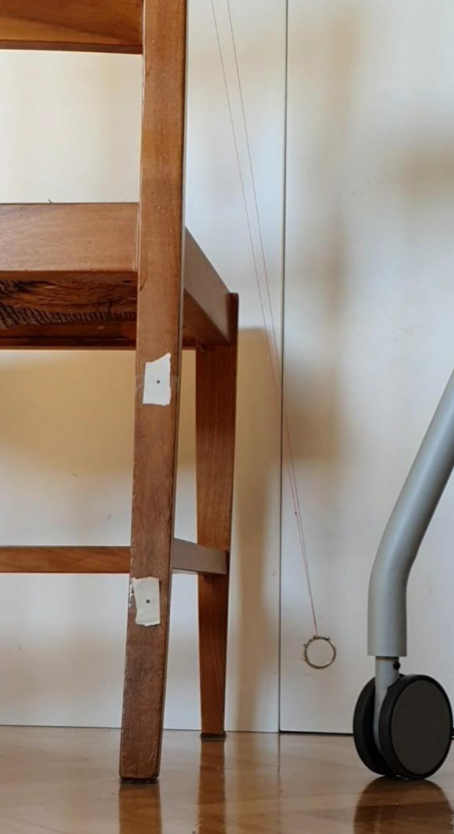
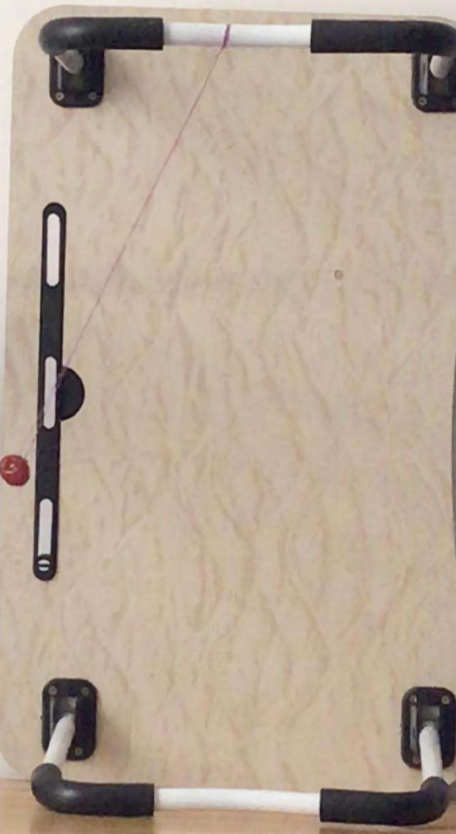
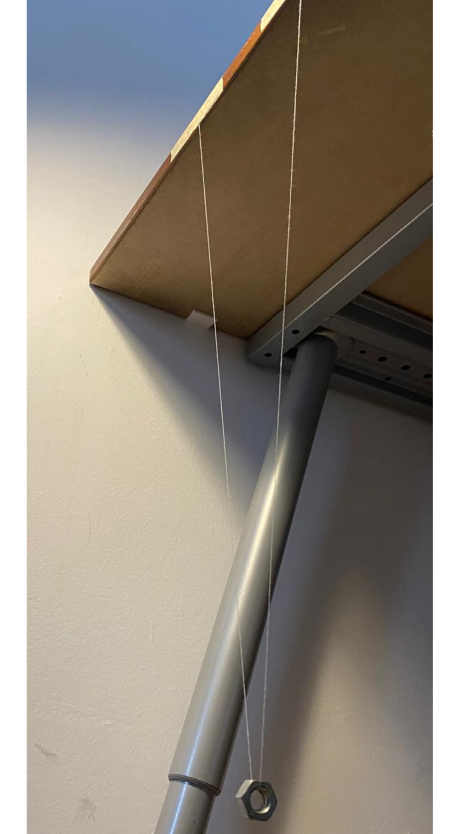
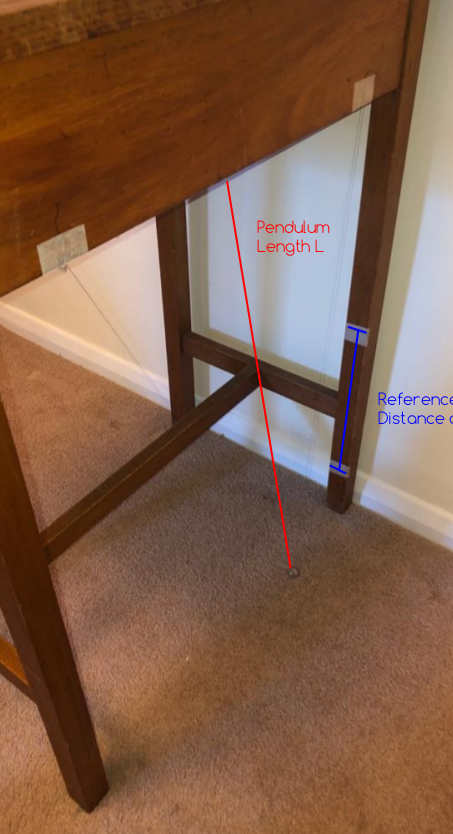
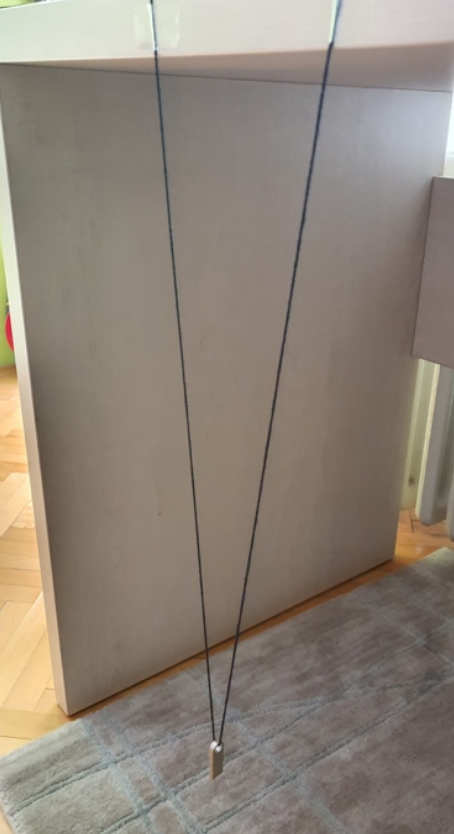
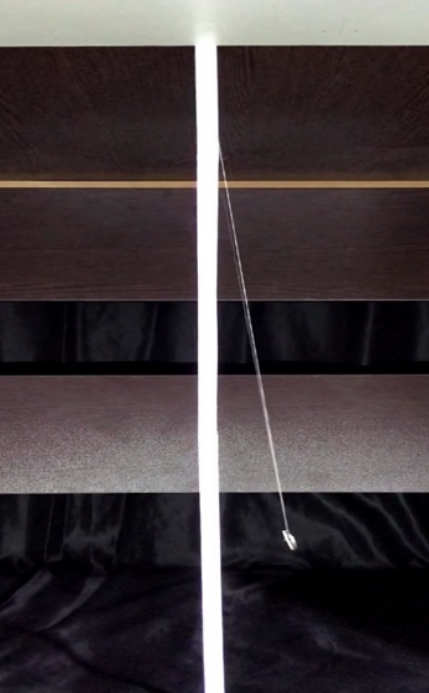
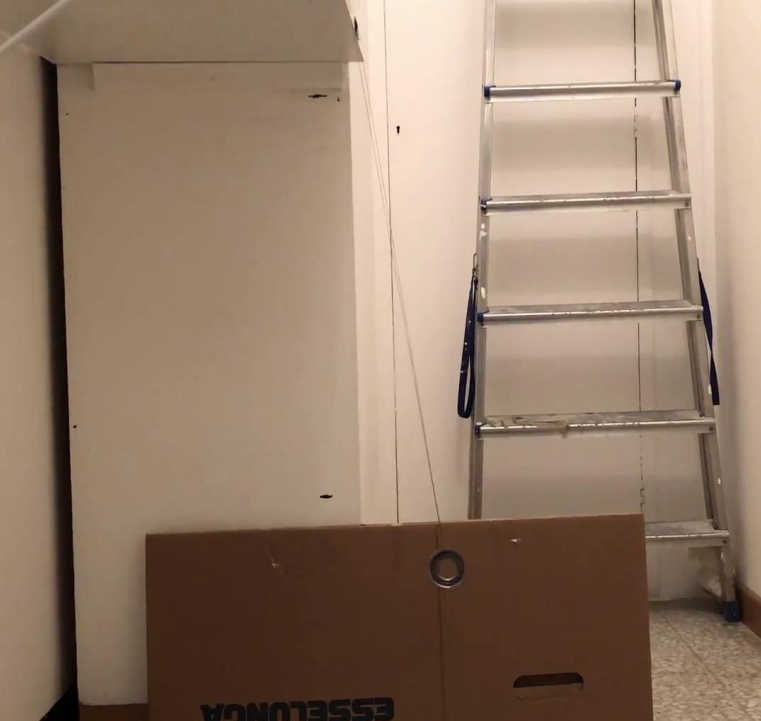
Measuring the oscillation period of a simple pendulum we can evaluate g, the gravitational acceleration. In the following document three activities, that can also be done at home, are proposed. It will guide you in the building of your own experimental apparatus also giving indications about data collection and analysis.
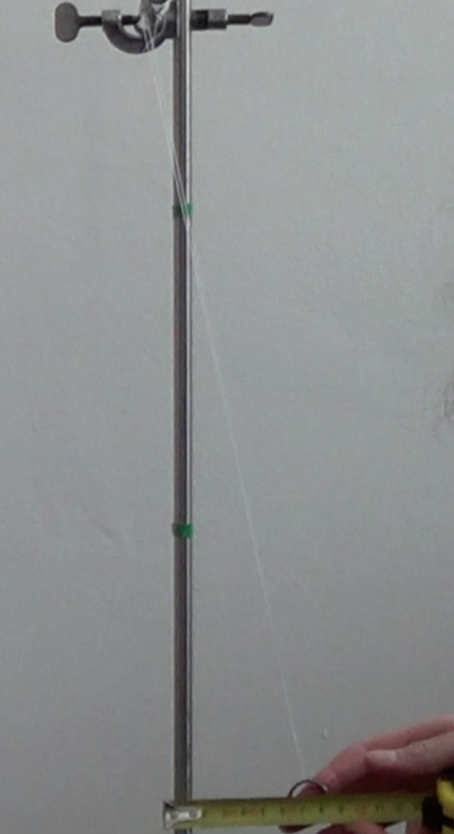
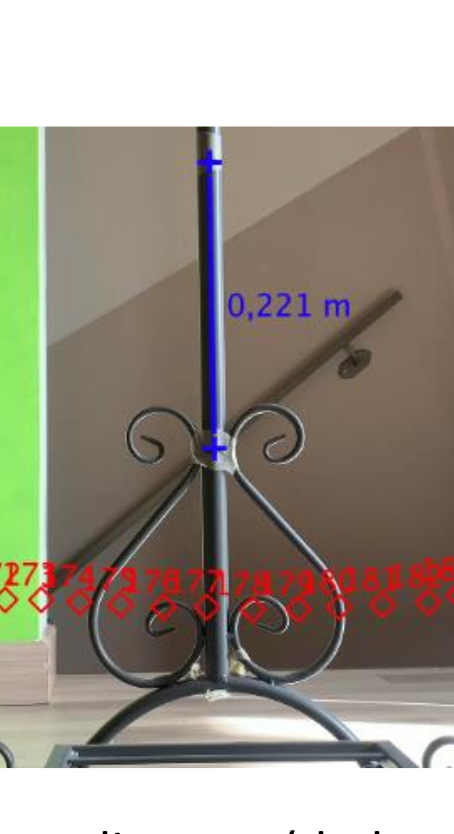
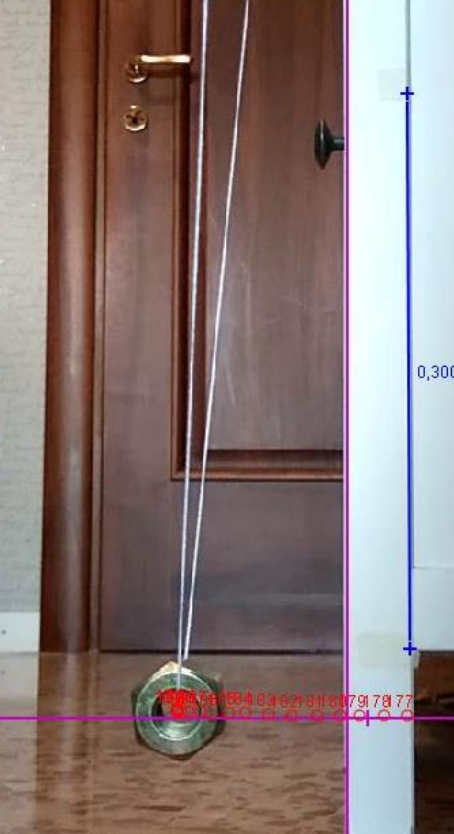
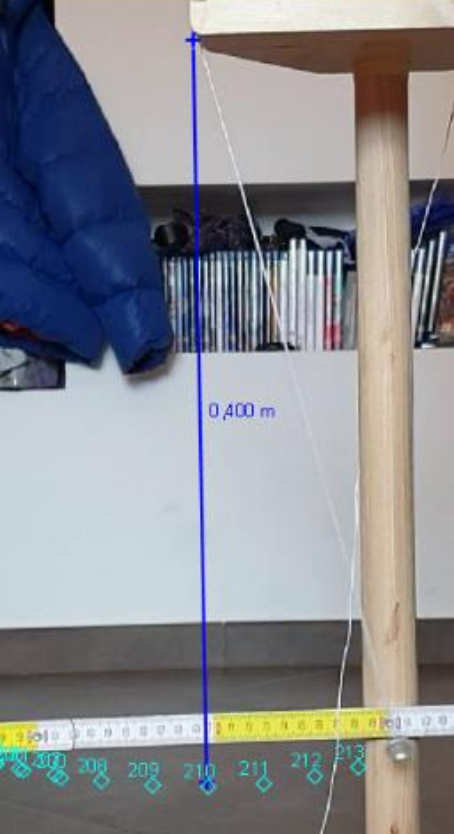
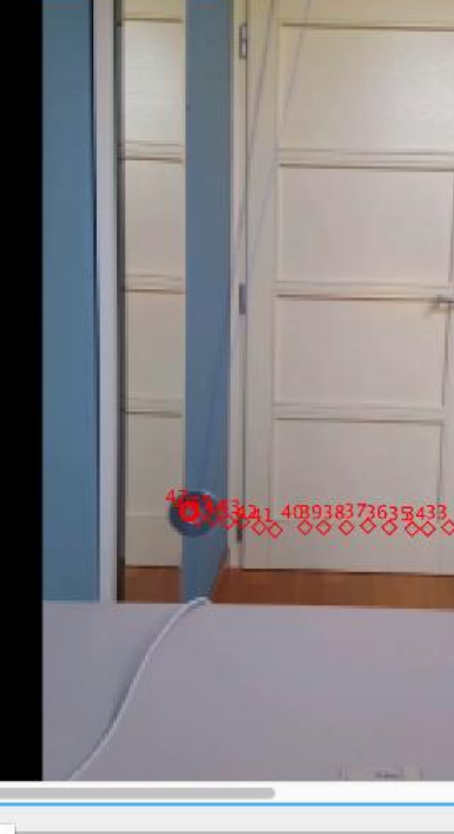
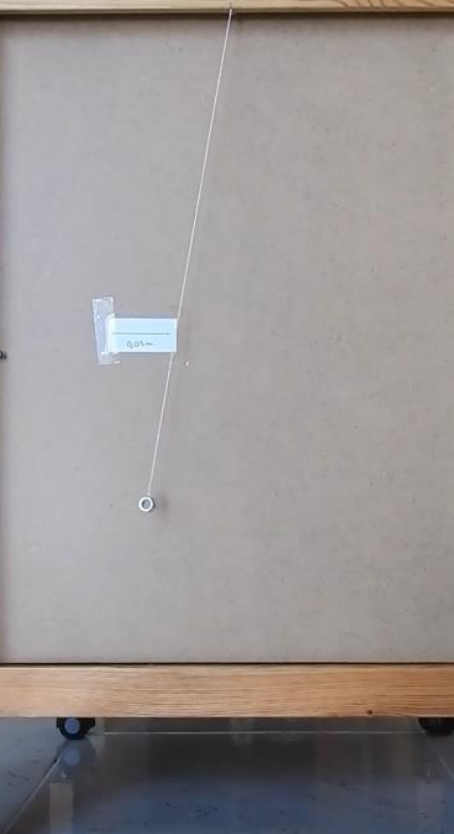
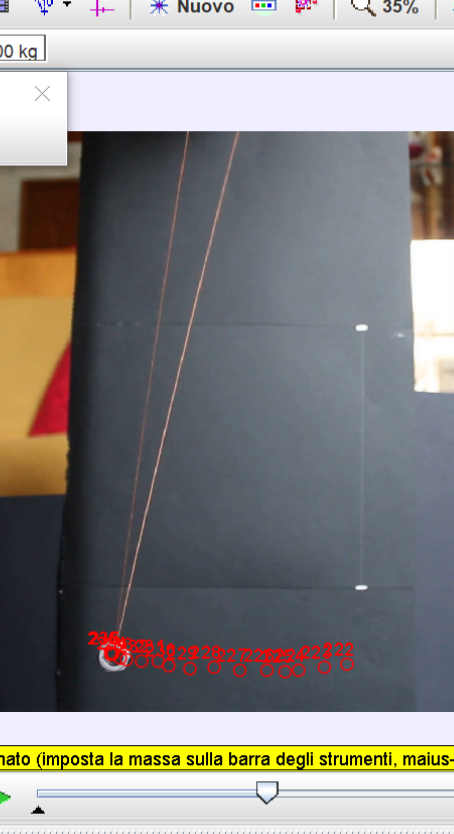
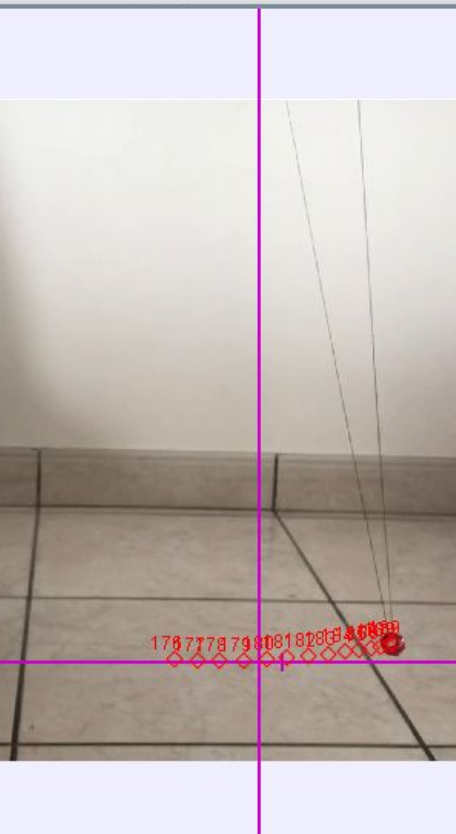
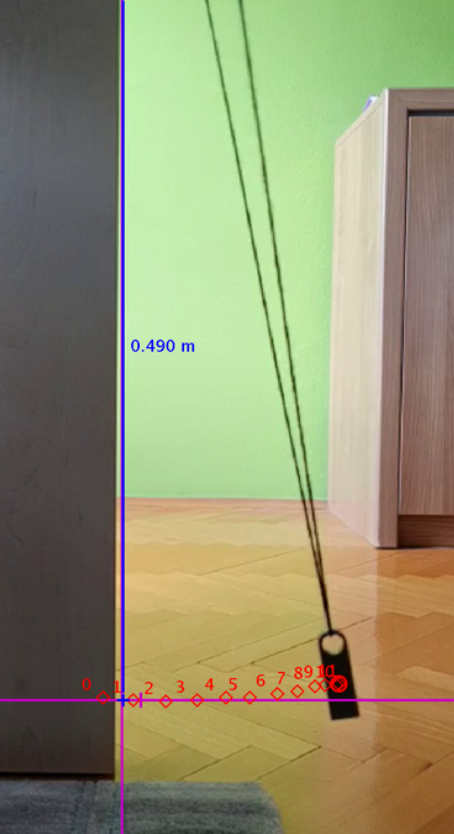
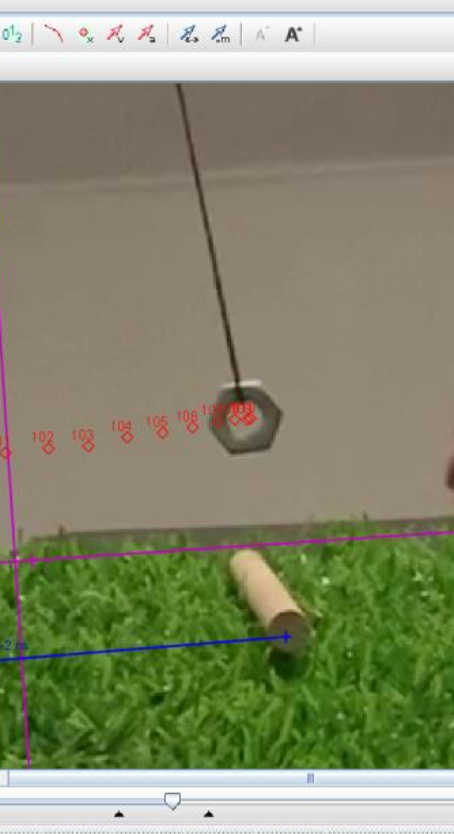
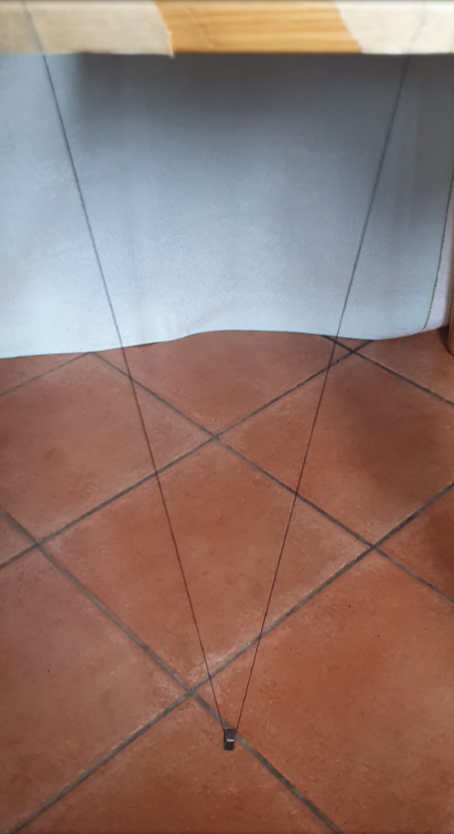
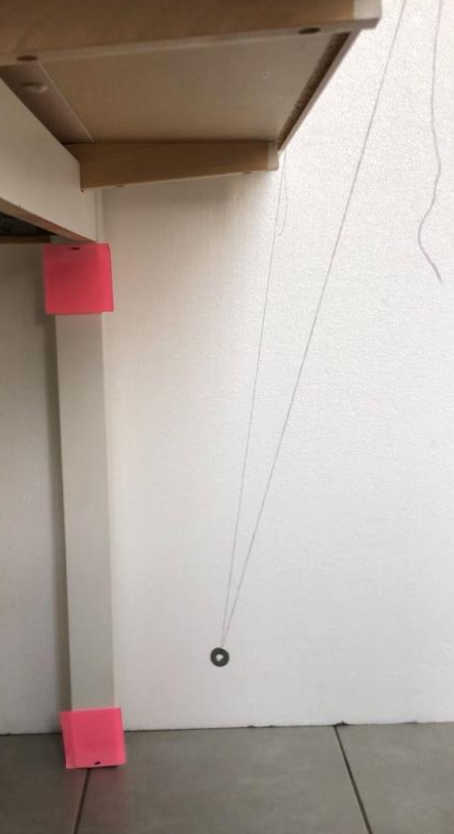
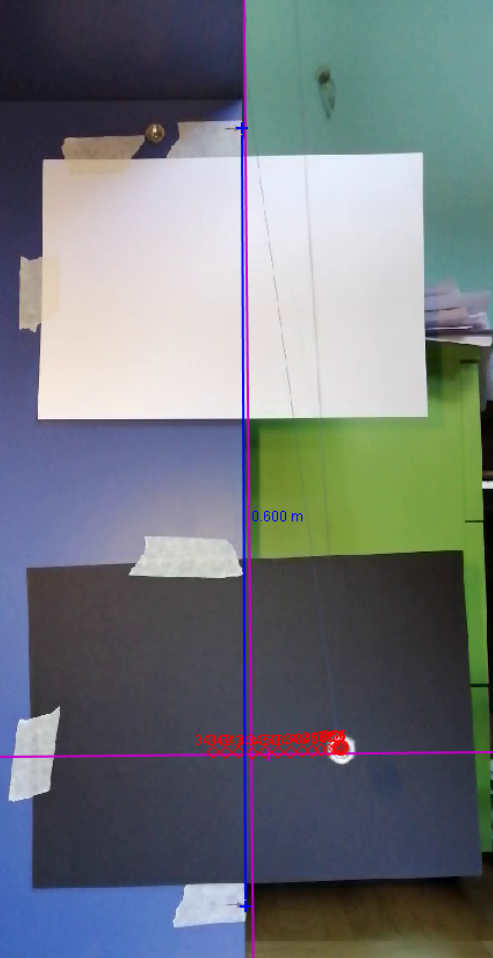
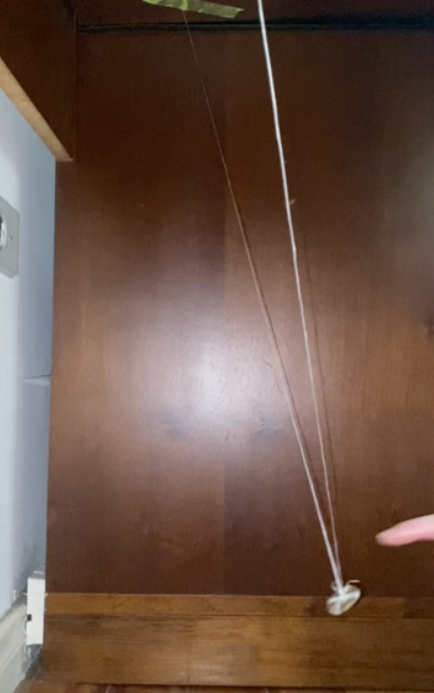
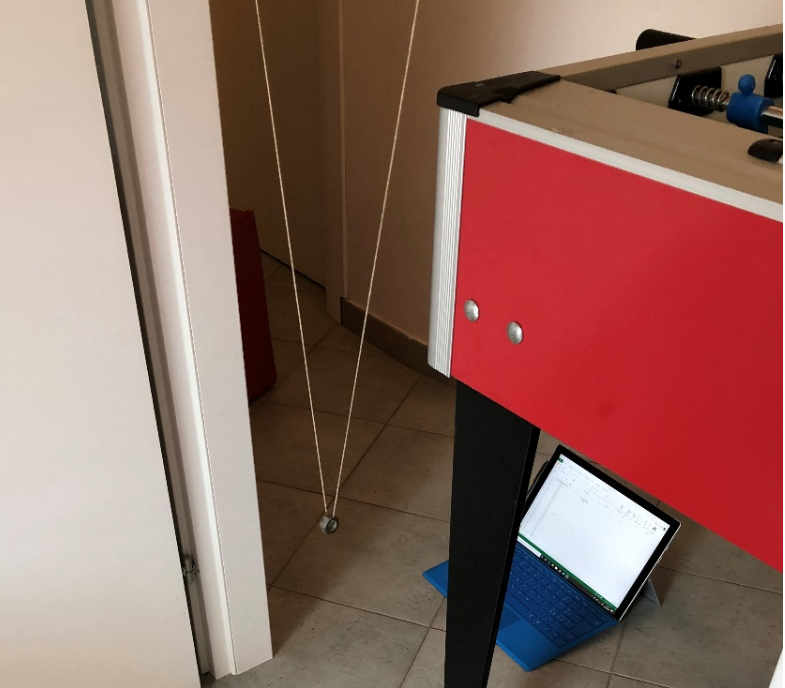
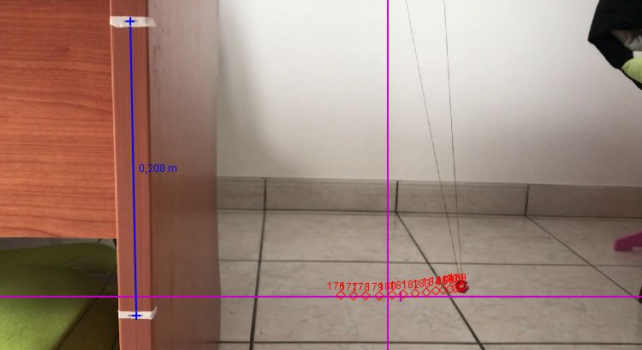
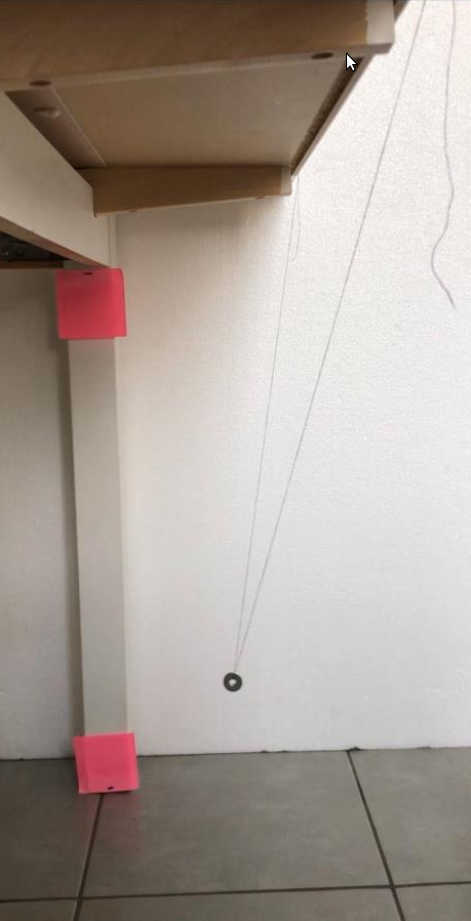
The first activity is based on a video of the oscillations of your own pendulum and on a free software, Tracker, allowing the tracking, in time and position, of the mass during its motion. The second experiment consists of a series of repeated measures of the time duration of 5 oscillations, from which you will get the period T of the pendulum. Once both the period T and the length L of the pendulum is known, the estimate of g is derived. The third experience fosters teamwork. Each group member builds a pendulum with a different length and measures L and T. Once data are shared the team finds the best fit of the experimental relation between T² and L. From the linear fit parameters g is derived.
On the page Tutorials you will find one video (in Italian) showing how to use Tracker, another video about how to evaluate the uncertainties through differentiation, the FAQs.
IMPORTANT. The Politecnico di Torino is collecting the experimental results of these experiments. Go to the FORM page and fill the forms inserting data and impressions about your experiment!
.
As you may guess from the images in the gallery at the bottom of the page, many students of the Politecnico di Torino used this page for the experiments of the Physics I courses during the Academic year 2019-20. Below you can have a look at the distributions of the values of g obtained by those who have filled out the Form up to now. Once you have finished you experiment fill the Form and share your results, the plots will be automatically updated including your work as well! Each plot shows the results that may be reached with each one of the three proposed activities.